Dear Friends and Neighbors,
Wow, Holiday Season 2017 is already here. Happy Holidays! (or is it too soon for some of you?!) I always wondered when is it proper to start greeting people with “Happy Holidays” But oh yes, we’re here to discuss real estate, so no matter where you fall on this most important quagmire, here are some of my thoughts about the real estate market in our area, served with interesting stats:
The DC area market is in its 16th straight month of declining inventory, which is good for sellers. August 2017 numbers showed inventory was down 4.4% compared to August 2016, and down 4.1% compared to July 2017. The median home price in the region in August rose to a decade record, as sales volume in July set a near all-time record. However, as inventory of homes continues to steadily decline month after month, the question on everyone’s mind is whether the trend will continue, pushing prices up, making home ownership less affordable even as interest rates remain low, hovering around 3.7%.
I do not anticipate a change in the coming months. Inventory will most likely remain low through the winter. Depending on the economic and political forecast in 2018, we may be seeing a change in the spring. One of the biggest issues at hand is lack of affordable homes for the downsizing population. Baby boomers who wish to remain in their town/city, find that downsizing does not apply to housing costs. Often times a reasonably sized condo will cost significantly more than the house being sold, and at best it’ll be a lateral move financially. This reality makes many would-be sellers delay the move or make adjustments for aging in place.
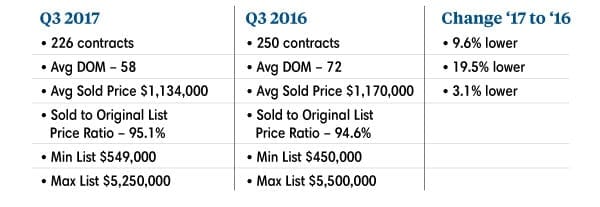
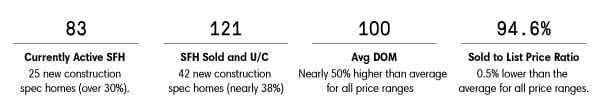
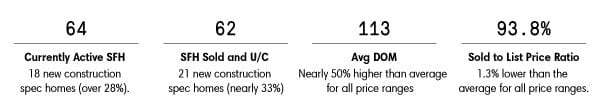
I’m leaving you with these questions for context as we zero in on the Bethesda-Chevy Chase market. The third quarter of 2017 was solid, in some aspects outperforming previous 3rd quarters. Overall, sellers who usually shy away from listing their homes during the summer months but who chose to list anyway, experienced positive results.