The buying trend in 2021 indicated the preference for close-in, urban-suburban neighborhoods! The big winners were Upper NW DC, Bethesda, and Chevy Chase, where sales were up by nearly 10% compared with the previous year. As a result, the Days on Market dropped significantly to just 7 days median (average was 21), and the average Sold Price to Original List Price Ratio (SP/OLP%) was 103.2%! In addition, sellers of single-family homes in 2021 enjoyed multiple offers with price-escalations and buyer concessions, the likes of which we hadn’t seen since 2005.
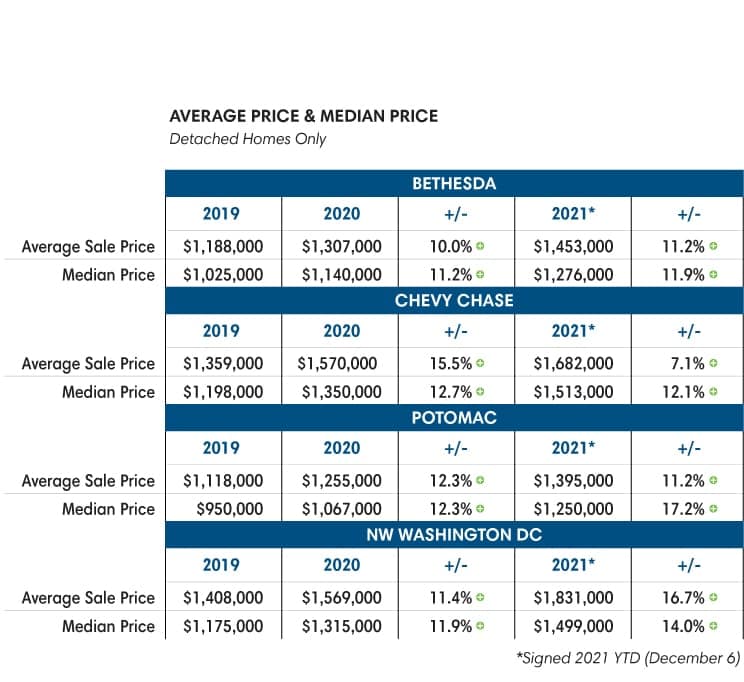
But perhaps the most dramatic news was the double-digit gains of homes during the last couple of years! In Bethesda, the value of detached homes increased 10% from 2019 to 2020 and another 11.2% in 2021. To put things in perspective, Bethesda homes appreciated 23.8% over the entire previous decade (2010-2019). Similarly, Chevy Chase detached homes appreciated on average 15.5% year over year in 2020 and another 7.1% in 2021. Potomac homes appreciated 12.3% in 2020 and another 11.2% in 2021. In NW Washington DC, detached homes increased 11.4% year over year in 2020 and another whopping 16.7% jump in 2021.
In DC, single-family homes sold on average 3.9% higher than the original asking price; for comparison, in the pre-Covid market of 2019, the average Sold Price to Original List Price Ratio was 98.6%. That’s a 5.3% spread! On the same token, DOM (Days on Market) dropped to 27 (median was 7) compared with 41 days in 2019 (pre-Covid market).z
Remember life before masks? Here we are in 2022, two years since we first heard about Covid-19; little did we know about the dramatic changes the pandemic will bring into our lives. With new variants popping up periodically and with still too-low vaccination rates among the population, it seems Covid-19 is here to stay a while longer and cement some of the fundamental changes in behavior and priorities we humans have adapted.
One of the major cultural shifts we have seen is the ever-increasing importance and evolving definition of what a home represents. As a result, the way we think of our homes inevitably changed, and the dependency and reliance on the real estate market, as a result, has been even more pronounced. The market data we bring to light in this report speaks volumes to these trends and changes. One of the main catalysts is redefining various industries’ workplace and work environment requirements.
The workforce, mainly blue-collar and non-college-educated workers in the United States and other industrialized countries, demand better pay and better employment terms and are writing a new chapter in our economy, empowered by high demand for workers and motivated by newly found family and home-centered purpose.
The numbers are staggering. The Bureau of Labor Statistics reported that 4.3 million Americans quit their jobs in September 2021 and another 4.2 million in October! Blue-collar worker shortages, travel restrictions, and disruption will continue to wreak havoc in the global supply chain, resulting in rising inflation in food, building materials, manufacturing materials, and supplies. The dramatic rise in home prices across the United States has also led to significant increases in rents, following the end of the moratorium on evictions and a steady decline in the availability of rental homes. To put things in perspective, the Washington Post reported the estimated gap between the number of homes needed and the number of homes available is at 5.24 million.
At the same time, the ever-growing gap between the haves and haves-not is steadily growing and reaching new levels. As a result, the rich get richer, even during a global pandemic, and the number of billionaires across the world is exploding. According to Forbes Magazine, the 400 wealthiest Americans saw their collective fortune increase 40% in 2021 over the last year, to a staggering $4.5 Trillion.
So, where’s the silver lining in all of this, you ask? Who said there is one? I don’t know. But, lowering the altitude from 250,000 feet (a reference to the altitude reached by Jeff Bezos’s Blue Origin space rocket), back to earth, and the DC Metro, our local economy, continues to be strong in its many layers and complexities. The DC region enjoys steady high-paying jobs, a very low unemployment rate, outstanding private and public schools, and a booming real estate market. This, combined with low inventory, which started a decade ago and was enhanced by Covid, significantly contributed to the sharp rise in real estate values. Join me as we take a deep dive into the local market and try to make sense of it all!
Sellers of Single-Family Homes Winning Big:
“In 2021, sellers of single-family homes enjoyed multiple offers with price-escalations and buyer concessions.”
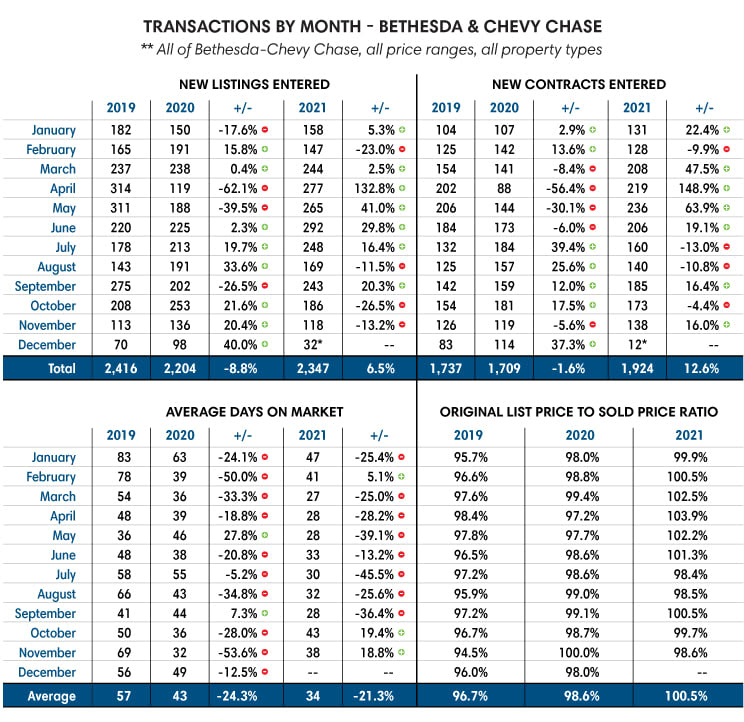
When the outbreak began in early 2020 and the mandatory quarantine was put in place, the market almost came to a complete stop. It was the beginning of the Spring Market, and the number of new listings in Bethesda-Chevy Chase dropped by 62% in April compared with the same period in 2019. It dropped another 40% in May, leaving everyone in the industry anxious and scrambling to adapt to the new reality. However, the following months made up for the shortfall, and in Washington DC, Bethesda, and Chevy Chase, the total number of transactions for the year in 2020 was down by a low single-digit. Potomac, however, saw a flurry of activity, with a 17% rise in transactions over the previous year, singling what would be a temporary bump in the “return to the suburbs.” By the way, homes with pools were all the rage in 2020, but that too has since subsided.
The buying trend in 2021 indicated the preference for close-in, urban-suburban neighborhoods! The big winners were Upper NW DC, Bethesda, and Chevy Chase, where sales were up by nearly 10% compared with the previous year. As a result, the Days on Market dropped significantly to just 7 days median (average was 21), and the average Sold Price to Original List Price Ratio (SP/OLP%) was 103.2%! In addition, sellers of single-family homes in 2021 enjoyed multiple offers with price-escalations and buyer concessions, the likes of which we hadn’t seen since 2005.
But perhaps the most dramatic news was the double-digit gains of homes during the last couple of years! In Bethesda, the value of detached homes increased 10% from 2019 to 2020 and another 11.2% in 2021. To put things in perspective, Bethesda homes appreciated 23.8% over the entire previous decade (2010-2019). Similarly, Chevy Chase detached homes appreciated on average 15.5% year over year in 2020 and another 7.1% in 2021. Potomac homes appreciated 12.3% in 2020 and another 11.2% in 2021. In NW Washington DC, detached homes increased 11.4% year over year in 2020 and another whopping 16.7% jump in 2021.
In DC, single-family homes sold on average 3.9% higher than the original asking price; for comparison, in the pre-Covid market of 2019, the average Sold Price to Original List Price Ratio was 98.6%. That’s a 5.3% spread! On the same token, DOM (Days on Market) dropped to 27 (median was 7) compared with 41 days in 2019 (pre-Covid market).


A Dramatic Growth of The Ultra-Luxury Market, $3 M and Above:
In 2019, the number of detached homes that sold over $3,000,000 in Bethesda, Chevy Chase, DC, and Potomac combined, was 62. (10 in Bethesda, 10 in Chevy Chase, 5 in Potomac, and 37 in Washington DC.) The average Days on Market in this ultra-luxury segment was 136, and the average Sold Price to List Price Ratio was 92.4%. In other words, these homes sold on average for 7.6% less than the asking price. Fast forward to 2021, the number of detached properties sold north of $3M jumped by 129% to 142 properties! (28 in Bethesda, 19 in Chevy Chase, 21 in Potomac, and 74 in Washington DC.) As a result, the DOM in 2021 in this sub-group dropped to 74, and the average Sold to List Ratio increased to 96.8%. Furthermore, 74 of the transactions were CASH, that’s more than 50% of all sales in the category. This is consistent with 2019, where 33 of the 62 sales in the category were also cash.

Affordability in Decline:
width="100%" On the other end of the spectrum, we continue to see a shrinking number of homes listed and sold under $700,000. For example, in 2010 (more than a decade ago), the number of homes sold in all of Bethesda-Chevy Chase at or below $700K was 259; in 2019, this number dropped to 88, and in 2021, a sharp drop of 77% to only 20 properties, all in just two years! In NW DC, the number of detached homes sold under $700K was 22 in 2021, compared with 190 in 2010! This is an 88.5% drop in a little over a decade.

New Homes:
The lack of inventory of “affordable” homes directly and profoundly impacts new homes as home-builder’s struggle to find new home-sites. The dramatic increase in lot price acquisition coupled with an out-of-control rise in building material costs has led to a significant shortage in new homes and a dramatic price increase. These prices, the new norm if you will, are here to stay! When I am writing this report, on December 7, there are only 17 new homes (2021-2022 construction) advertised for sale in all of Bethesda-Chevy Chase. These homes are averaging $2,719,000 asking price, where the median asking price is $2,400,000. If buyers are willing to pay the full asking price on average, which data indicates, most do, we are looking at an incredible 34.8% increase in median prices for new homes from the pre-Covid market of 2019! As far as reported sales (advertised, not including private sales or custom homes!), in 2021, we had 68 transactions (homes built 2020-2021), of which 24 are still pending, and 45 were settled. The 45 settled homes indicate an average sale price of $2,005,000. Compare this in stark contrast to pre-pandemic 2019, where there were 99 total transactions (45% increase), and the median price was $1,780,000, a 12.6% increase.

Condo Market:
Common wisdom tells us that the condo market took a hit in 2020 because of the pandemic, as more and more people moved into single-family homes in search of more living space, home office, and private outdoor space. Indeed, condos with no balconies were more difficult to sell, as common rooftop decks and other common amenities in condo buildings were closed for health concerns. However, as Americans learned to live with the virus, 2021 marked a change that somewhat returned to normal. In NW Washington DC, the number of condos sold in 2021 increased by 13.4% and in Bethesda-Chevy Chase by 16.5%, compared with 2020.
In Bethesda and Chevy Chase, the number of condos sold (signed contracts) in 2021 was 542 across all price ranges, a significant 16.5% increase compared with 465 units sold in 2020. In addition, the median price in the B-CC condo market was $339,000, up by 6% from the median price of $319,000 in 2020 and on par with the median price in 2019, which was $337,000 – in essence, no increase, just a return to pre-Covid levels. This can be explained by the understandable hesitation of buyers to move into condo buildings with the Covid-19 outbreak in early 2020.
A further look into the condo market reveals that in 2019 pre-pandemic, the number of luxury condos sold in B-CC at or above $1,000,000 was 56, with an average of 105 Days on the Market and 93% Sold to List Price Ratio. In comparison, in 2020, the number fell to 34, a 39% decrease! Again, 2021 signifies a return to some normalcy in the real estate market with 55 units sold – virtually the same as 2019 – and while the average DOM increased to 149 days, sellers saw slightly better results with a Sold Price to Original List Price Ratio at 94.5%.
In NW Washington DC, the number of Condo units sold in 2021 was 3,514, a 13.4% increased activity compared with 2020 and, in fact, an even bigger increase from 2019. The Median price for a condo unit in NW was $476,000 in 2019, $513,000 in 2020, and $505,000 in 2021.
The ultra-luxury condo market in NW DC (at or above $2,000,000) yielded 30 transactions in 2021 with an average of 139 DOM and a 91.1% Sold Price to Original List Price Ratio. (SP/OLP%). Surprisingly, 2020 was slightly stronger with 31 transactions, 104 DOM on average, and a stronger SP/OLP% of 93.8%. The Pre-Covid market in 2019 yielded 26 sales with an average of 91.8% SP/OLP%.
I Am Often Asked, when Is the Best Time to Sell?
While there’s no definitive answer to this question, as it all depends on macro and micro circumstances for example, an outbreak of a global pandemic there are certainly trends that we track annually that offer a general guideline.
The Spring Market (March through June) typically shows stronger results for sellers. Our market does have seasonality, but as the 2019-2021 sales chart below shows, there’s truly no “bad” time to sell since mostly, our market has been defined by low inventory for years.
In Closing:
At the end of my 2019 report, I concluded with the following phrase:
“May you live in interesting times.” I think we are overwhelmingly blessed!
Little did I know then what was coming our way and how profound this saying would be. Wow! I don’t know what is yet to come or how our lives will change during these challenges and opportunities, but I hope measures of kindness, acceptance of one another, and a shared sense of responsibility will win the day. I hope you enjoyed reading this real estate market report – it is a labor of love!
And as always, if you have any real estate needs, please do not hesitate to reach out. It will be my pleasure to offer my guidance and services and tailor a plan to your goals and needs.
All the best in the New Year.