Happy New Year! And just like that, another decade has gone by! I can’t help but think about the world our great-grandparents lived in during the 1920’s and what great achievements humanity has made in just 100 years. Here in Washington D.C., the Memorial Continental Hall was completed in 1920, home to the national headquarters of the Daughters of the American Revolution (DAR). In the residential real estate world, Bungalow-style homes were all the rage in the 1920’s, and they remain popular today, often being restored by buyers.
Looking as far back as December 2018, it was a tumultuous month, at least when it comes to the economy. To jog your memory, in December 2018 the stock market registered the worst month in over a decade and the government entered the longest shutdown in U.S. history. Yet, our local real estate market in Q1 2019 was a robust quarter with gains in almost all indicators, following a particularly slow market during the second half of 2018, where sales dropped about 12.5% compared with the same period in the previous year.
Fast forward to December 2019, and the picture is quite different. The U.S. economy is strong. The S&P 500 rose 29% in 2019 to close over 9,000 points for the first time, with analysts declaring the S&P had its best year since 1997. The Nasdaq gained an impressive 35%, led by giant tech companies such as Google/Alphabet, Amazon, and Microsoft. While only half of Americans are invested in the stock market, these gains have a tremendous impact on the psyche of all Americans when it comes to rising consumer confidence and spending habits. The buzz word during most of the first half of 2019 was “Recession”… it’s due and it’s imminent, we were told. But recession seems far off now, as the economy continues to grow and the job market strengthens and the unemployment rate remains at an all time low.
This is the macro in a nutshell, the backdrop to what’s happening in our local real estate market. It’s important to be aware of the macro, but as you and I know, it doesn’t tell the whole story of the forces influencing our local real estate market. Residential real estate is hyper-localized; neighborhoods within the same zip code may be subject to different market forces and therefore show different patterns. This is also true for different price ranges within the same zip or geographical area.
In the following annual market analysis, I will touch on various data points and break it down to different segments, show trends, and put things in historical prospective.
The Big Picture
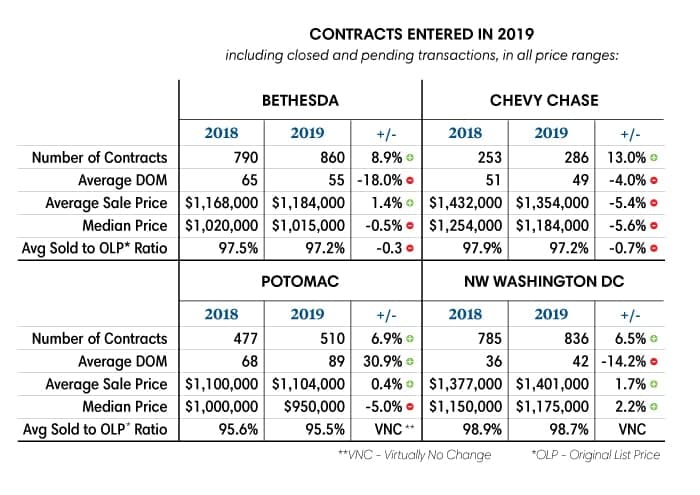
The number of sale contracts to purchase single family homes (SFH) entered in Bethesda (all zips, all price ranges) in 2019 was 860, an 8.9% jump from 2018. The increased activity was felt particularly during the first six months of the year. More about that later. The average Days on Market dropped by 18% from 65 in 2018 to 55 in 2019, an indicator of greater buyer activity and demand.
Similarly, the number of contracts entered in 2019 in Chevy Chase, MD was 286, up from 253 in 2018, a 13% rise. Avg DOM was 49, down from 51 in 2018, and the Average Sold to Original List Price Ratio was 97.7%, virtually no change from 2018.
In Potomac, a more modest but welcome increase in the number of contracts, up by 6.9% to 510 in 2019. The average DOM increased however to 89 days, compared with 68 in 2018 and the Average Sold Price to Original List Price Ratio was 95.5%, virtually no change from the previous year.
Lastly, in NW Washington DC, the single-family home market also did better comparatively to the previous year with 836 new contracts entered, a 6.5% increase. Days on Market dropped to 36 on average, down from 42, and the Average Sold Price to Original List Price Ratio was 98.7%.
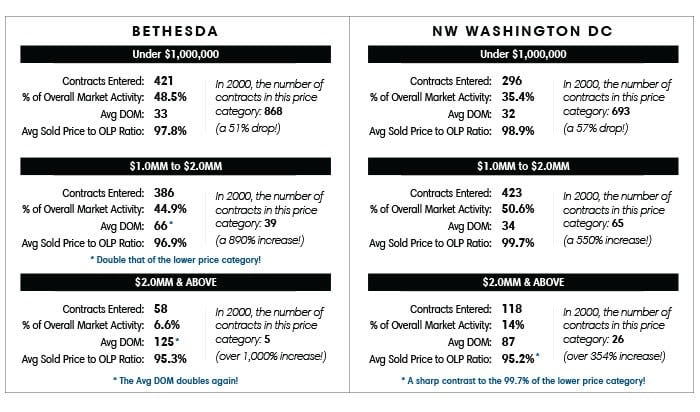
 Single Family Homes Breakdown by Price Category 2019
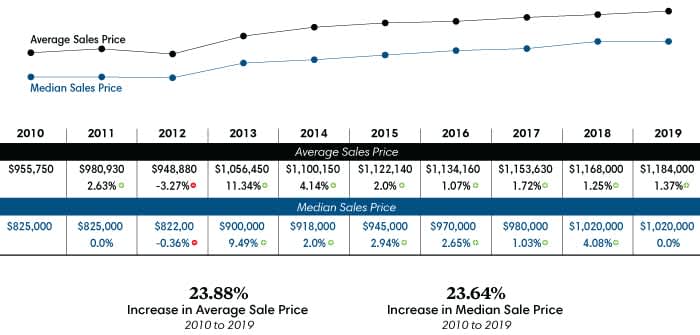
A Decade of Slow and Steady Appreciation:
The past decade for Bethesda detached homes was overall positive. The average sale price of a single-family home rose by 23.88% as the median sale price similarly increased by 23.64%. The first couple of years of the decade were more volatile, as the market was just beginning to recover from the great recession of 2008. The strongest year was 2013 with double digit gains in the average sale price of a home. The years 2015 through 2019, however, were defined by a slow and steady increase year-to-year.
Breakdown for Washington DC, Chevy Chase and Potomac are available upon request.
New Home Market:
The new in-fill home market has always represented a significant part of the overall home market in Bethesda. In 2019, keeping with previous years, a total of 94 new construction homes went under contract in Bethesda, representing nearly 11% of the overall market. Additionally,12 new homes sold in Chevy Chase, MD, and only 5 new homes in Potomac, representing less than 1%. These numbers typically do not represent true custom homes where the owners contracted a GM to build a new home on the lot they own.
In Bethesda and Chevy Chase (106 homes combined), the average price of a new home rose to $1,920,000, compared with 2010 where the average price for a new home was $1,644,000, a significant jump of 16.8%. That’s not surprising, given the acquisition cost of land has gone up, construction costs are on the rise, and various local taxes on teardowns have increased, as well.
Affordability Trends:
In my Summer 2019 market report (January – July 2019) , I noted that less than 50 homes in Bethesda-Chevy Chase had sold under $700,000 compared with 161 homes under $700,000 during the same period in 2010 – a 70% drop! Indeed, the entry-level to our market is becoming more elusive.
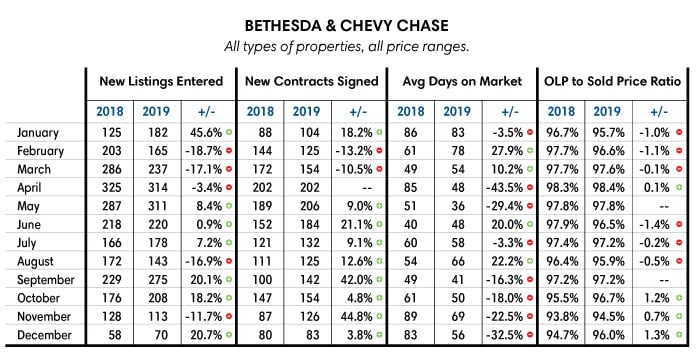
Transactions by Month:
(Bethesda and Chevy Chase, all types of properties, all price ranges)
I am often asked, “When is the best time to sell?” While there’s no definite answer to this question, as it all depends on circumstances from the stock market to the weather, competition, interest rates, what a certain President may or may not do, etc., there are trends that can be tracked and offer a general guideline. According to the 2019 data, the months with the most transactions were May, April, June, March, and October, in that order.