
2022 Annual Market Report – Luxury Special Edition
Market Reports Avi Galanti
Market Reports Avi Galanti
As noted in our general market report, the upper bracket market in our region continues to expand, as the median sale price in the affluent neighborhoods of DC and nearby suburbs increased significantly over the past three years. A look at Bethesda, Chevy Chase, and Potomac combined, shows a total of 205 upper bracket properties (including condos) were sold at or above $3M between 2020 and 2022 (time of contract). Of the 208 properties, 88 were reported as cash purchases and, as such, 43% of all transactions did not depend on obtaining financing. When compared to the previous three years (2017-2019), only 77 properties were sold at or over $3M, an increase of 266% in this segment of the market.
In NW DC, 366 properties (including detached homes, row-homes, and condos) were sold at or above $3M in a span of the last three years (2020-2022), with 220 of them reported as cash transactions, or 60%. During the previous three years (2017-2019), only 193 properties in all of NW DC were sold at or above $3M. Again, a rapid increase of the market segment of 189%, period over period.
Now, let’s dive a bit deeper and examine various price points in 2022 vs 2021. For the purpose of this mini-study, we expanded the price range to $2,000,000 and above, detached homes only, in Bethesda, MD, all zip codes. More specific information about other areas in the DC Metro area is available upon request.
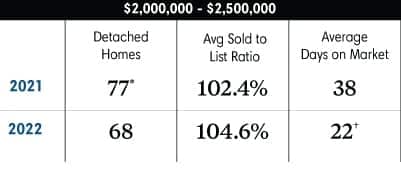
*Of the 77 homes, 17 were new construction homes.
†Included in the average DOM are 20 transactions (29.4%) that had 0 or 1 DOM reported in MLS. Of the 68, 16 were new construction homes – 23.5%.
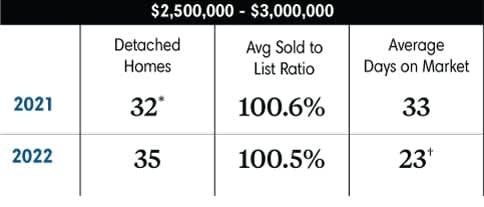
*Of the 32 homes, 10 were new construction homes.
†Included in the DOM average are 7 homes (20%) that had 0 or 1 DOM reported in MLS. Of the 35, 7 (20%) were new construction homes.
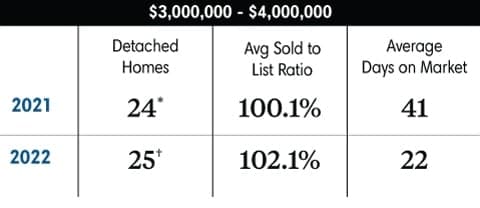
*Of the 24, 7 were new construction homes. The Ave S/L Ratio for this new construction subgroup was 99.3%!
†20% (5 out of 20) were sold off-market and entered into the MLS after a contract was signed. Of the 25, 7 were new construction homes. The Avg S/L Ratio for this subgroup was 107.5%!
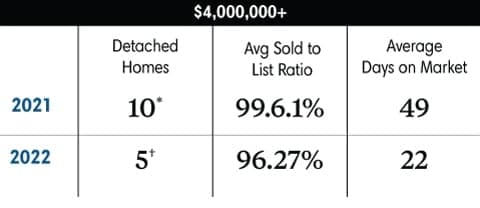
*Three of the 10 (30%) were sold over $5M. None were brand new construction. Four of the 10 (40%) were sold off MLS and entered into MLS post sale.
†50% fewer homes sold and on average their L/S Ratio performed 3.3% worse than in 2021. Three of the 5 (60%) were listed and sold over $5M. One of the 5 (20%) was new construction; 2 (40%) were sold off- MLS. Of those sold on-MLS, the avg DOM was 114 days (a 130% increase compared to 2021!)
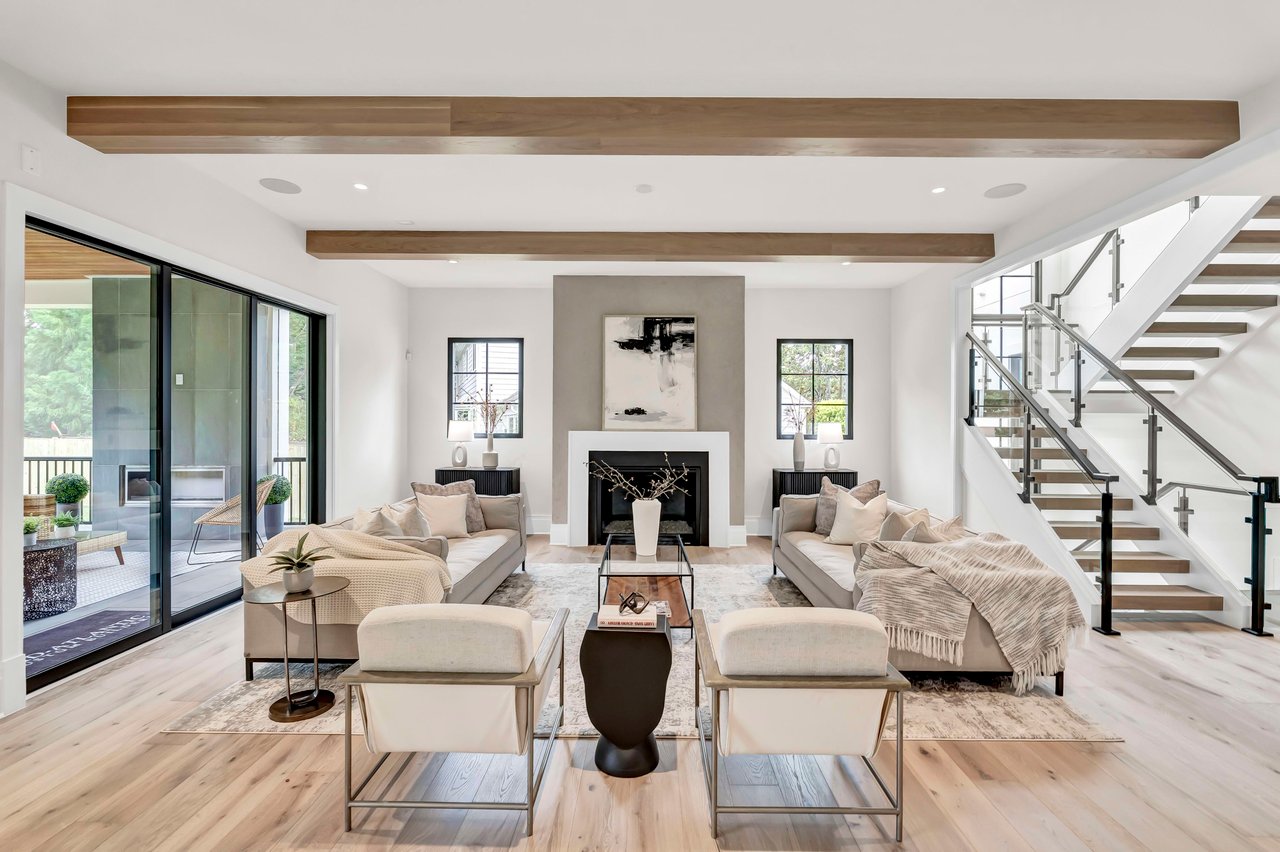
There’s no question the luxury market in our region is more resilient, even though conventional wisdom might suggest otherwise. Furthermore, the goalpost in terms of the way we think about and define luxury real estate has changed and continues to change. The upper bracket buyer is looking for more unique architectural exterior with striking interior design and upgraded features, the incorporation of artistic spaces, as well as cutting edge residential technology.
I hope you enjoyed reading this real estate market report – it is a labor of love! If you are interested in an analysis of a specific segment of the market or would like to discuss your personal real estate needs, please do not hesitate to reach out. It would be my pleasure to offer my guidance and services and tailor a plan to your goals.
All the best in the New Year
Tim Phelps
Nestled in the heart of Bethesda, Maryland, Alta Vista is a charming neighborhood that offers a perfect blend of suburban tranquility and urban convenience.
Market Reports
Avi Galanti
The ultra-luxury real estate market in Washington, D.C., Maryland, and Northern Virginia is rapidly expanding. Despite its relative youth, this market faces intense co… Read more

Karen Galanti
As the leaves turn and the air gets crisper, Montgomery County transforms into a haunting playground for thrill-seekers and ghost enthusiasts. If you’re looking for a … Read more
Diego Sito
Downtown Bethesda, Maryland, epitomizes the perfect blend of urban sophistication and suburban charm, making it a highly coveted area for condominium living.
Diego Sito
Bethesda, Maryland, known for its affluent neighborhoods, top-notch schools, and proximity to Washington D.C., has long been a sought-after location for homebuyers and… Read more

Avi Galanti
When the desire for a serene escape and a glass of fine wine calls, the picturesque vineyards and wineries just a short drive from Washington, D.C., provide the perfec… Read more
Karen Galanti
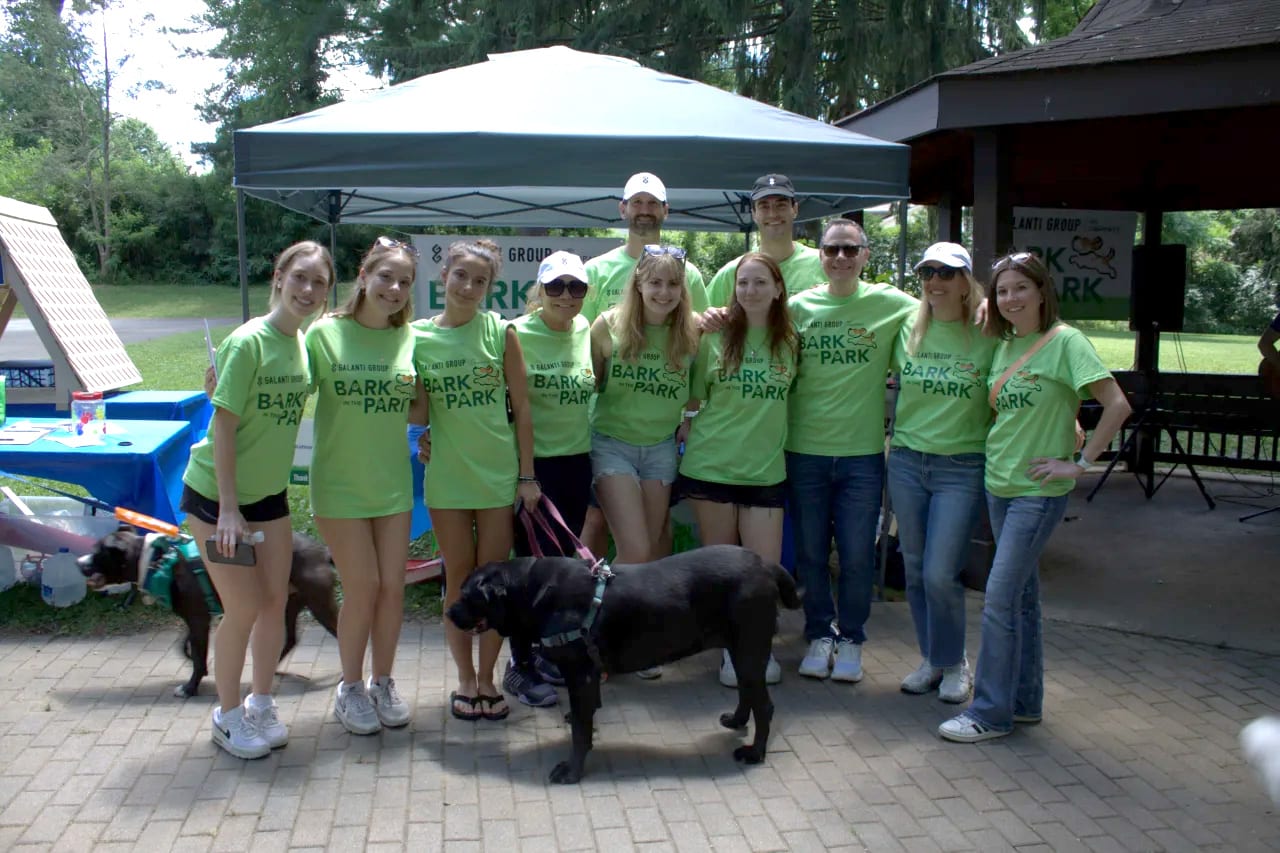
We want to extend a heartfelt thank you to everyone who attended our first-ever Bark in the Park event.
Market Reports
Avi Galanti
The most common question I hear from acquaintances and people who recognize me as a real estate professional is, “How’s the real estate market doing?”

Kris Feldman
In the midst of the pandemic, when outdoor activities became a lifeline for many, the sport of pickleball emerged as a game-changer
Bringing together a team with the passion, dedication, and resources to help our clients reach their buying and selling goals. With you every step of the way.